
US Energy Independence vs. Global Oil Price Spikes 2026: Are We Truly Shielded?
US Energy Independence vs. Global Oil Price Spikes 2026: Are We Truly Shielded? :The headlines of March 2026 are dominated by a singular, chilling narrative: “US Stocks Selloff Extends as Iran War Escalates.” With the Strait of Hormuz effectively closed and global supply chains in a chokehold, American investors and consumers are asking one critical question: “I thought we were energy independent—so why am I paying $5 a gallon?”
As the conflict disrupts approximately 20% of the world’s oil supply, the disconnect between “Energy Dominance” and the reality of the gas pump has never been more apparent. Here is a deep dive into the battle between US domestic production and the relentless nature of global oil markets in 2026.
The Mirage of the “Shield”: Why Independence Isn’t Immunity
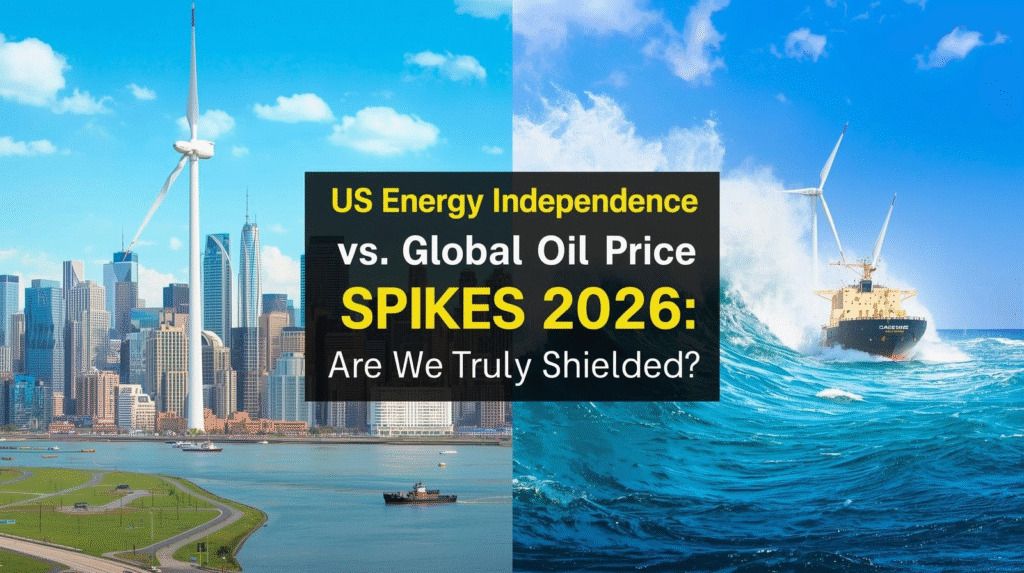
Image Source: Canva AI
In early 2026, the United States reclaimed its title as the world’s leading energy producer. Under a renewed “Drill, Baby, Drill” policy framework, domestic crude production hit a record 13.6 million barrels per day. On paper, the US produces enough to cover a massive portion of its needs.
However, “Energy Independence” does not mean “Price Independence.” Here is why:
- The Global Benchmark Trap: Oil is a fungible global commodity. Even if every drop of oil consumed in Texas was drilled in Texas, the price of that oil is set on the global stage. When Brent Crude (the international benchmark) skyrocketed to $114 per barrel this month due to the Iran conflict, domestic WTI (West Texas Intermediate) naturally followed suit, despite the US being a net exporter.
- Refining Realities: Many US refineries are calibrated to process “heavy” crude from abroad, while US shale produces “light” sweet crude. This creates a logistical paradox where we must export our own oil while still importing specific grades to keep our refineries running.
- The “Fear Premium”: Markets trade on the future, not just the present. The threat of a prolonged war in the Middle East adds a “geopolitical risk premium” that local production simply cannot neutralize.
Go to Homepage
The 2026 Price Gap: WTI vs. Brent
One of the most fascinating trends of the current crisis is the widening spread between WTI and Brent. As of mid-March 2026, we are seeing a rare $20+ discount gap.
| Benchmark | Price (March 2026) | Reason for Shift |
| Brent Crude | ~$115.00 | Direct impact from Strait of Hormuz closure and Middle East supply loss. |
| WTI (US) | ~$95.00 | Insulated by massive domestic supply and SPR releases, but still dragged up by global demand. |
While Americans are paying less than Europeans (who are facing a full-blown energy catastrophe), a $95 barrel of oil still translates to painful prices at the pump for US commuters.
The Strategic Petroleum Reserve (SPR) Gamble
To combat the 2026 selloff, the US government has authorized a historic release of 172 million barrels from the Strategic Petroleum Reserve. This move is designed to “flood the zone” and prevent WTI from hitting the dreaded $150 mark.
The risk? This drawdown is projected to push the SPR to its lowest levels since 1982—approximately 243 million barrels. While this provides a short-term ceiling for gas prices, it leaves the US with a thinner “insurance policy” if the Iran conflict expands into a multi-year regional war.
Winners and Losers in the 2026 Energy Shift
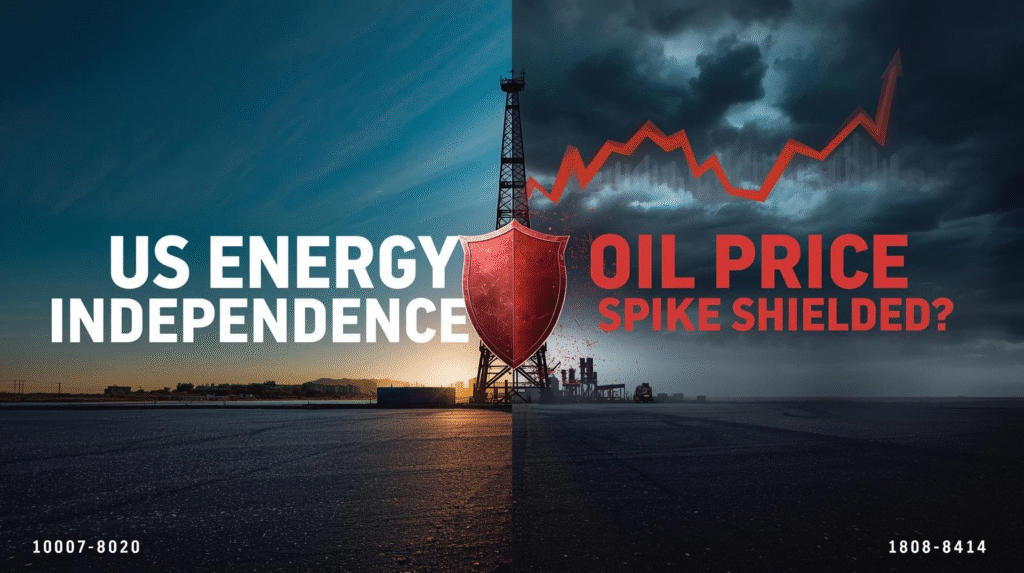
Image Source: Canva AI
The Winners:
- Upstream Producers: Companies like ExxonMobil and Chevron are seeing record free cash flow as they sell domestic oil at global-crisis prices.
- Renewable Infrastructure: The volatility of 2026 has reignited the “Electric Independence” movement. Solar and battery storage deployment has tripled since 2022 as homeowners seek to “unplug” from the global oil rollercoaster.
- Defense Contractors: With US naval escorts now active in the Persian Gulf, the aerospace and defense sectors remain the only green spots in a sea of red stock market tickers.
The Losers:
- The US Consumer: Low-income households are currently spending nearly 20% of their disposable income on energy—the highest level in decades.
- Airlines & Logistics: Companies like Delta and FedEx are grappling with jet fuel prices that have surged 70% since the onset of hostilities.
- The Tech Sector: High energy costs act as a “hidden tax” on the economy, pulling liquidity out of growth stocks and into “survival” commodities.
Final Outlook: Is Independence Possible?
The crisis of 2026 proves that Energy Independence is a powerful tool for national security, but it is not a magic wand for price stability. As long as the US remains tethered to a global oil market, a fire in the Middle East will always be felt in the American Midwest.
For the US-based audience, the takeaway is clear: 2026 is the year of the Energy Hedge. Whether through diversifying portfolios into energy ETFs or finally making the switch to a heat pump or EV, the goal is no longer just “producing more”—it’s about becoming less vulnerable to the next global price spike.